
Download Jupyter Notebook File: ipynb File
Get Solar Capacity Factors
We can get the capacity factor for each country from the Global Photovoltaic Power Potential by Country. This dataset contains the GIS data used in the report, "Global Photovoltaic Power Potential by Country" generated by Solargis funded by the World Bank. The study summarizes global solar resource and PV power potential on a country and regional basis.
This data assumes free-standing structures, monofacial crystalline silicon PV modules fixed mounted at an optimum tilt to maximize the yearly energy yield and the use of high-efficiency inverters.
It takes into account the solar radiation, air temperature, and terrain to simulate the energy conversion and losses in the PV modules and other components of a PV power plant. The simulation assumes a loss of 3.5% due to dirt and soiling. The cumulative effect of other conversion losses including inter-row shading, mismatch, inverters, cables, and transformers—is assumed to be 7.5%. The power plant availability is considered to be 100%.
The relevant column 'Average practical potential kWh/kWp/day', is actually just capacity factor times 24. See footnote
The sunniest are:
| Capacity Factor | |
|---|---|
| Country | |
| Namibia | 22.4% |
| Chile | 22.4% |
| Jordan | 22.1% |
| Arab Republic of Egypt | 21.9% |
| Republic of Yemen | 21.7% |
| Oman | 21.5% |
| Saudi Arabia | 21.5% |
| Lesotho | 21.4% |
| Libya | 21.4% |
| Botswana | 21.3% |
The least sunny are some of the most highly developed countries in the world
| Capacity Factor | |
|---|---|
| Country | |
| Lithuania | 12.0% |
| Netherlands | 11.9% |
| Latvia | 11.9% |
| Denmark | 11.8% |
| Sweden | 11.8% |
| Estonia | 11.8% |
| Isle of Man (U.K.) | 11.5% |
| Norway | 11.5% |
| United Kingdom | 10.9% |
| Ireland | 10.5% |
It is surprising that there is a factor of two between the capacity factor of installations in the least sunny and most sunny countries. Capacity factor is not the only variable affecting potential. Perhaps the largest issue facing these northern countries is that the vast majority of the solar energy lands during the long summer days. There is no feasible means of efficiency storage such large quantities of electricity for 6 months.
The land-area averaged, global capacity factor is:
Get Primary Energy consumption data
BP Statistical Review of World Energy is the most widely trusted and canonical estimate of primary energy consumption used worldwide.
The definition of Primary energy is the total chemical energy in the fossil fuels burned that year, plus the the equivalent amount of fossil fuel input required to generate electricity produced by non-fossil sources in a fossil fuel power plant assuming 40.625% efficiency. See footnotes
BP only lists the consumption of the 81 main countries. Other countries are categories in to groups such as "Other Caribbean".
I immediately convert the data "primary_ej" into annual averaged Watts.
| Primary Energy Consumption [GW] | |
|---|---|
| Country | |
| Total World | 18870 |
| Total Non-OECD | 11581 |
| Total Asia Pacific | 8638 |
| Total OECD | 7289 |
| China | 4998 |
| Total North America | 3605 |
| US | 2948 |
| Total Europe | 2612 |
| Total EU | 1906 |
| Total CIS | 1279 |
| Primary Energy Consumption [GW] | |
|---|---|
| Country | |
| Croatia | 11 |
| Slovenia | 9 |
| Lithuania | 8 |
| Estonia | 8 |
| Iceland | 7 |
| Other Southern Africa | 6 |
| Latvia | 5 |
| Luxembourg | 5 |
| Cyprus | 3 |
| North Macedonia | 3 |
Note that these primary energy figures from BP (and IEA and EIA) were originally designed to measure fossil fuel consumption not the useful energy that they provide accounting for conversion efficiency. Obviously, the primary energy used in generating electricity is much higher than the electricity provided as most of the chemical energy of the fuel is lost as waste heat, out of the cooling towers. So when it comes to non-fossil generated electricity, to make for a useful comparison, they convert the electricity generated by non-fossil fuels, in terms of the fossil fuel energy that would have been required to produce the was generated using a conversion efficiency of 40.625%. The global average energy consumption rate using the 'fossil fuel equivalency method' is therefore:
In other words the electrical component of this of this fossil fuel demand is only 40% of the primary energy figures in the BP data. About 1/3 of primary energy is used to generate electricity. Therefore, nuclear and renewables only need to replace 1/3 * 0.4 + 2/3 = 80% of primary energy supply to meet demand.
| Primary Energy Consumption [GW] ignoring waste heat from non-fossil fuels | |
|---|---|
| Country | |
| Total World | 15096 |
| Total Non-OECD | 9265 |
| Total Asia Pacific | 6910 |
| Total OECD | 5831 |
| China | 3998 |
| ... | ... |
| Other Southern Africa | 5 |
| Latvia | 4 |
| Luxembourg | 4 |
| Cyprus | 2 |
| North Macedonia | 2 |
104 rows × 1 columns
Calculated Data
We now have the two key pieces of data per country to make the calculation:
$P$ primary energy consumption per nation (in Watts)
$C_f$ is Capacity factor of solar per nation (in Average Watt output per Watt at Peak Capacity)
Lets take the total global power consumption average land-area-weighted global solar capacity factor:
But now, we need to make a few assumptions in order to use these values to calculate land area. This is where the common-sense comes in.
Energy Demand Assumptions
The first step is to scale the primary energy down according to some assumptions to get the actual energy demand we are intending to supply
| Symbol | Name | Description | Source |
|---|---|---|---|
| P | Primary Energy [W] | Average consumption in Watts averaged over most recent year: 2021 (from BP) | known per country |
| G | Growth in Consumption | Factor by which the primary energy consumption has grown when this plan is implemented | assumption |
| S | Solar Proportion | Fraction of energy that solar will supply | assumption |
| R | Efficiency Factor | Factor by which electrifying transport and heating and changing behavior can reduce final energy demand | assumption |
Solar Proportion
Lets assume that solar supplies all our power as many people smart people seem to believe. For example Elon Musk is very bullish on the potential of solar. At an on-stage conference appearance, he says “you could easily power all of China with solar”, to rapturous applause. Twitter is often swayed by infographics claiming the same. For example: an area of panels the size of Spain accompanied by the claim, that it could power the world. Elon replied with: ‘Exactly’. Elon Musk used a graphic in his Tesla Power Wall presentation in 2015 in which he showed a tiny blue square, the size of Connecticut intended to represent the area of solar panels to power the entire USA.
This excellent video claims that the area required to power all of the world is close to the size of france (551,695 square km),
Growth in Consumption
Lets make the unrealistic assumption that growth remains constant despite the certainty that it will rise. The OECD countries (Europe, North America, Australia and East Asia) represent around half the world's energy consumption despite possessing less than 1/5 of the population. But the developing world is catching up fast. For the Non-OECD to just to reach the standard of OECD, we will have to triple global energy consumption. Lets assume, miraculously, that it remains constant.
Efficiency Factor
Electrifying heating and transport can make things more efficient. It important to distinguish this from the fact that most of the fossil fuel energy used to generate electricity is waste heat which we don't need to provide at all - we've already accounted for this;
I delved into the electrification efficiency question separately. In summary, according to the most optimistic observers, we can hope to save 40%, primarily, through the 'higher energy-to-work conversion efficiency of using electricity for heating, heat pumps, and electric motors, and using electrolytic hydrogen in hydrogen fuel cells for transportation, compared with using fossil fuels.'
In addition, we get savings from the elimination of energy needed to mine, transport, and refine coal, oil, gas, biofuels, bioenergy, and uranium And assume a modest additional policy-driven energy-efficiency measures beyond those under BAU (business-as-usual).
I am currently unclear whether this accounts for the actuarial issue with primary energy which I resolved earlier by scaling down by 0.8. But i'll consider it anyway, as I am looking for the most optimistic scenario.
The second step is getting a reasonable estimate for the net amount of electricity that solar can deliver, considering all lifetime costs. We are essentially trying to get a figure of average annual solar power output per unit of land area in: $W/m^{2}$.
The most important value is the installed capacity of existing solar farms. You might think that the way to calculate solar PV potential is just to multiply the incident radiation energy by the efficiency of the panel, but this ignores key considerations.
We also need to consider Construction, maintenance, disposal, recycling and transport are borne by the existing fossil fuel infrastructure.
| Symbol | Name | Description | Source |
|---|---|---|---|
| C_f | Capacity Factor | Average output divided by installed capacity (from SolarGIS paid for by World Bank) | known per country |
| C | Installed Capacity [W/m^2] | Installed capacity (max possible output) of solar power per unit land area in Watts / square metre | assumption |
| E | Embodied Energy | Energy used to construct the panel as a proportion of lifetime output | assumption |
| M | Maintenance Energy | Energy consumed in maintenance of the system as a proportion of lifetime output | assumption |
| O | Overbuild | Factor of overproduction required to account for insufficient storage for intermittent supply | assumption |
As a first start, lets take the following optimistic estimates and apply them to the global totals to get a minimum estimate of the global land area we will need to cover with solar farms.
Installed Capacity
The installed capacity per unit area depends on what sort of panel efficiency and layout density the solar farm can achieve. It isn’t affected by the location. The relevant value is the “MW-ac” – the alternating current that it is capable of sending to the Grid after electrical inversion. This is approximately 80% of the “MW-dc”. Hereafter, I refer to MW-ac simply as MW.
- California Solar PV Land Use efficiency in 2013 was 35W/m2.
- The US Average Land Use efficiency in 2013 was 42.5 W/m2 (5.8 acres/MW) for a Fixed Axis, Large (>20MW) capacity-weighted average.
Embodied Energy
It typically takes the first 2 years of the solar panel's 20 year life to pay back the embodied energy consumed in the manufacturing. We have to account for this by discounting 13% of the lifetime energy output. The first two years are the most productive part of the panel life, but lets assume energy output doesn't decay through the lifetime.
Maintenance Energy
Some energy is used for cleaning, repair, recycling, transport and disposal. Lets assume it is 1% until I have better data.
Needless to say, these estimates are unrealistic, especially the overbuild factor. But they provide a bare minimum unachievable according to the laws of physics.
Now I will use these scaling factors to calculate the total area of solar panels required.
Therefore solar can produce:
It seems like a lot. But what does it mean in terms of the space we have left on planet earth?
Therefore a minimum of around a percent of the earth's land area is required to sustain our present energy needs.
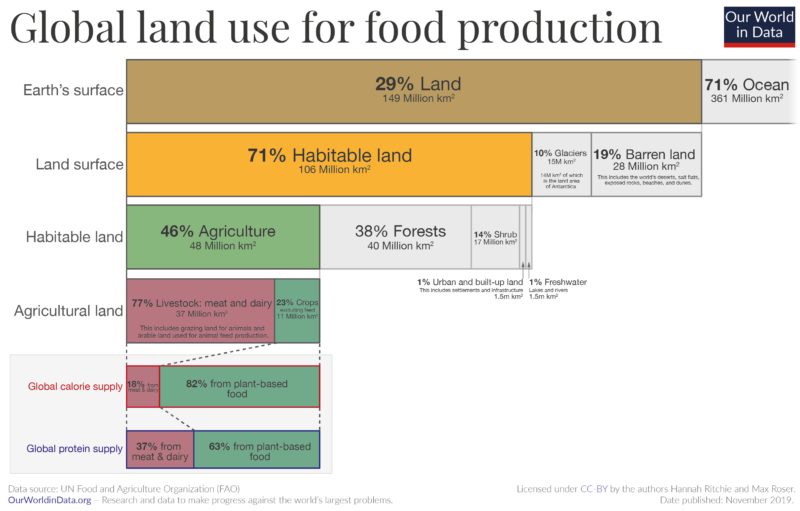
Land is primarily used for agriculture. Note how on this diagram, only 1% is 'Urban area and built up land'. Its true that a huge quantity of land is managed for farming. But it is one thing tending to crops and another thing building physical infrastructure.
Also, this 1% refers to the total urban area, not artificial objects. A study of global inventory of the spatial distribution and density of roads, parking lots, buildings, driveways, sidewalks and other manmade surfaces, which it called 'constructed impervious surface area (ISA)' was published in 2007 by a collaborative team involving US National Geophysical Data Center, NASA and US Department of Energy. It measured the reflectivity of the ground using satellite imagery. The global ISA represents the extant footprint of every structure human civilisation has created. It estimated the ISA to be 579,703 km². An area the size of France.
The solar area is technically the land-use for the entire farm, of which around half to a third depending on access requirements and the need for spacing to overcome self-shading. So the necessary panel area is at a minimum, several times larger than that of existing human structures.
Lets calculate the area required for all nations using the same parameters:
It actually doesn't look so bad for many of the less densely populated, sunnier countries. The problem is in europe in particular, the place that seems most interested by solar power.
Footnotes
Solargis - Average practical potential
'Average practical potential $kWh_{output} \cdot day^{-1} \cdot kW^{-1}_{capacity}$' is actually just capacity factor times 24.
For example, a solar farm with a $1 kWh_{output} \cdot day^{-1} \cdot kW^{-1}_{capacity}$ means it produces 1 kWh per day, for each 1 kW of capacity
Giving a capacity factor of 4.2 % In other words;
$$C_f [\%]= Capacity\ Factor\ [\%], = \frac{Average\ practical\ potential\ kWh_{output}d^{-1}kW^{-1}_{capacity}}{24 hours}$$Primary Energy
BP is the source for present and historic consumption used by Our World in Data.
Gap-Minder still quotes the World Bank estimates of primary energy even though this is no-longer available.
The definition of Primary energy is the:
- total chemical energy in the fossil fuels burned that year,
- plus the the equivalent amount of fossil fuel input required
to generate electricity produced by non-fossil sources in a fossil fuel power plant assuming 40.625% efficiency.
- plus an estimate of the biomass chemical energy burned from the supply of electricity using biomass assuming 32% efficiency.
Traditionally, in bp’s Statistical Review of World Energy, the primary energy of non-fossil based electricity (nuclear, hydro, wind, solar, geothermal, biomass in power and other renewables sources) has been calculated on an ‘input-equivalent’ basis – i.e. based on the equivalent amount of fossil fuel input required to generate that amount of electricity in a standard thermal power plant.
For non-fossil electricity (excluding biomass-powered electricity)
2018 onwards: the annual rate of efficiency improvement is based on the simplified assumption that efficiency will increase linearly [from 40%] to 45% by 2050. [I.e. it is assumed as 40.625% in 2022]
For Bio-mass plants:
In this edition, we assume a constant efficiency of 32% for biomass power to better reflect the actual efficiency of biomass power plants.
Download the ipynb for a slider-based interactive map
interactive(children=(FloatSlider(value=0.6, description='R, Electrification', max=1.2, min=0.3, step=0.06), F…